先日、後輩がAndroidアプリのデバッグをしていたのですが、Android StudioのEvaluate Expression機能を知らなかったようで原因調査に予想以上に時間がかかっていました。
その姿を見ながら、私自身はGDBを触った経験が「デバッガーでできること」を理解するのにとても役立っているなと感じたので記事にしてみました。
ということで、今回はCUIのデバッガーであるLLDBの基本的なコマンドを紹介します。
GDBじゃなくてLLDBを取り上げた理由は、「XCodeでもそのまま使えるから」です。
キーマップが違うコマンドもありますが、
基本的なコマンドはGDBかLLDBかを意識しなくても同じように使えると思います。
準備
まずは、デバッグの対象がないと始まらないので、次のようなhello.cを用意しました。
#include <stdio.h>

void sayHello(int);

int main() {
    sayHello(3);
    return 0;
}

void sayHello(int count) {
    for (int i = 0; i < count; i++) {
        printf("Hello\n");
    }
}
また、実行環境は下記の通りです。
[alpaca]~ % sw_vers
ProductName:    Mac OS X
ProductVersion: 10.11.5
BuildVersion:   15F34

[alpaca]~ % gcc -v
Configured with: --prefix=/Applications/Xcode.app/Contents/Developer/usr --with-gxx-include-dir=/usr/include/c++/4.2.1
Apple LLVM version 7.3.0 (clang-703.0.31)
Target: x86_64-apple-darwin15.5.0
Thread model: posix
InstalledDir: /Applications/Xcode.app/Contents/Developer/Toolchains/XcodeDefault.xctoolchain/usr/bin

[alpaca]~ % lldb -v
lldb-350.0.21.9
LLDBで実行できるバイナリをつくる
gccでは、オプションを何もつけずにコンパイルを行うと様々な最適化処理が行われ、デバッグに必要な情報がなくなってしまいます。
そこで、LLDBで実行できるバイナリを生成するためには、gオプションをつけてコンパイルする必要があります。
また、O0オプションで最適化レベルも下げておきましょう。
ついでに実行権限も付与します。
[alpaca]~ % gcc -g -O0 hello.c -o hello
[alpaca]~ % chmod +x hello
[alpaca]~ % ./hello
Hello
Hello
Hello
LLDBの基本
まずはLLDBを使って、helloプログラムを実行してみましょう。
LLDBは対話式にコマンドを打ちながら操作していきます。
プログラムの実行は、rコマンド、lldbの終了はqコマンドです。
[alpaca]~ % lldb hello
(lldb) target create "hello"
Current executable set to 'hello' (x86_64).
(lldb) r
Process 71418 launched: '/Users/rhoboro/hello' (x86_64)
Hello
Hello
Hello
Process 71418 exited with status = 0 (0x00000000)
(lldb) q
プログラムが実行されて、「Hello」が3回表示されていることがわかります。
ヘルプの表示はh listのようにh+コマンドで表示できます。
listは実行中のソースコードを表示してくれるコマンドです。
(lldb) h list
     Implements the GDB 'list' command in all of its forms except FILE:FUNCTION and maps them to the appropriate 'source list' commands.  This command takes 'raw' input (no need to quote
     stuff).

Syntax: _regexp-list [<line>]
_regexp-list [<file>:<line>]
_regexp-list [<file>:<line>]

'list' is an abbreviation for '_regexp-list'
(lldb) l 2
   2
   3    void sayHello(int);
   4
   5    int main() {
   6        sayHello(3);
   7        return 0;
   8    }
   9
   10   void sayHello(int count) {
   11       for (int i = 0; i < count; i++) {
ブレークポイント
まずは、ブレークポイントを作ってみましょう。
b 6で6行目にブレークポイントを作って、bで現在のブレークポイント一覧を出力、br delete 1で1番目のブレークポイントの削除をしています。
(lldb) b 6
Breakpoint 1: where = hello`main + 20 at hello.c:6, address = 0x0000000100000f24
(lldb) b
Current breakpoints:
1: file = '/Users/rhoboro/hello.c', line = 6, exact_match = 0, locations = 1
  1.1: where = hello`main + 20 at hello.c:6, address = hello[0x0000000100000f24], unresolved, hit count = 0

(lldb) br delete 1
1 breakpoints deleted; 0 breakpoint locations disabled.
ここからは、XCodeのスクリーンショットも交えながら機能を紹介していきます。 XCodeだと行番号のところをクリックすると青いブレークポイントの印がつきます。
プレークポイントをはった状態でプログラムを実行してみると、ブレークポイントをはったところでその実行を一時中断できます。
ちなみにブレークポイントでとまるのは、その行が実行される前となります。
(例えば、代入分にブレークポイントをはっているところで停止した場合、まだ左辺に値は代入されていない状態です。)
(lldb) b 6
Breakpoint 2: where = hello`main + 20 at hello.c:6, address = 0x0000000100000f24
(lldb) r
Process 71162 launched: '/Users/rhoboro/hello' (x86_64)
Process 71162 stopped
* thread #1: tid = 0x2ff2e1, 0x0000000100000f24 hello`main + 20 at hello.c:6, queue = 'com.apple.main-thread', stop reason = breakpoint 2.1
    frame #0: 0x0000000100000f24 hello`main + 20 at hello.c:6
   3    void sayHello(int);
   4
   5    int main() {
-> 6        sayHello(3);
   7        return 0;
   8    }
   9
ブレークポイントで止まっている時は、主に次の3つのコマンドで先に進めることができます。
s: 関数の中に入っていきます。(ステップイン)
(lldb) s
Process 71162 stopped
* thread #1: tid = 0x2ff2e1, 0x0000000100000f4b hello`sayHello(count=3) + 11 at hello.c:11, queue = 'com.apple.main-thread', stop reason = step in
    frame #0: 0x0000000100000f4b hello`sayHello(count=3) + 11 at hello.c:11
   8    }
   9
   10   void sayHello(int count) {
-> 11       for (int i = 0; i < count; i++) {
   12           printf("Hello\n");
   13       }
   14   }
n: 現在の関数の中で次の行に進みます。(ステップオーバー)
(lldb) n
Hello
Hello
Hello
Process 71171 stopped
* thread #1: tid = 0x2ff4be, 0x0000000100000f2b hello`main + 27 at hello.c:7, queue = 'com.apple.main-thread', stop reason = step over
    frame #0: 0x0000000100000f2b hello`main + 27 at hello.c:7
   4
   5    int main() {
   6        sayHello(3);
-> 7        return 0;
   8    }
   9
   10   void sayHello(int count) {
c: 次のブレークポイントまで進みます。(コンティニュー)
(lldb) c
Process 71175 resuming
Hello
Hello
Hello
Process 71175 exited with status = 0 (0x00000000)
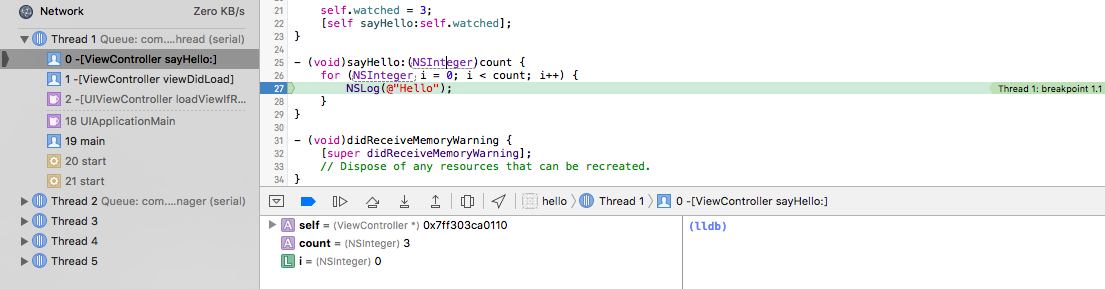
XCodeでは、画面中段青いブレークポイントのマークから右に向かって、c、n、s(+一番右はステップアウト)となっています。
条件つきブレークポイント
ブレークポイントは下記の様に条件を細かく設定することができます。
下記では、hello.cの12行目でiが2のときに停止するようなブレークポイントをセットしています。
(lldb) br s -f hello.c -l 12 -c i==2
Breakpoint 8: where = hello`sayHello + 37 at hello.c:12, address = 0x0000000100000f65
(lldb) r
Process 71580 launched: '/Users/rhoboro/hello' (x86_64)
Hello
Hello
Process 71580 stopped
* thread #1: tid = 0x303f80, 0x0000000100000f65 hello`sayHello(count=3) + 37 at hello.c:12, queue = 'com.apple.main-thread', stop reason = breakpoint 8.1
    frame #0: 0x0000000100000f65 hello`sayHello(count=3) + 37 at hello.c:12
   9
   10   void sayHello(int count) {
   11       for (int i = 0; i < count; i++) {
-> 12           printf("Hello\n");
   13       }
   14   }
(lldb) expr i
(int) $20 = 2
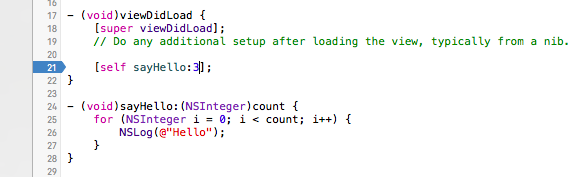
XCodeだとここで設定できますね。
WatchPoint
ブレークポイントの一種で、設定したグローバル変数の値が変更される時に停止してくれます。 今回のhello.cでは、グローバル変数がないので紹介だけにしておきます。
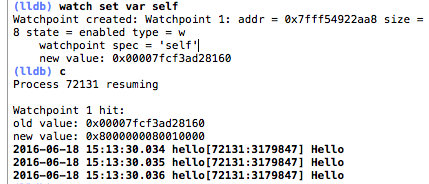
(lldb) watch set var global_var
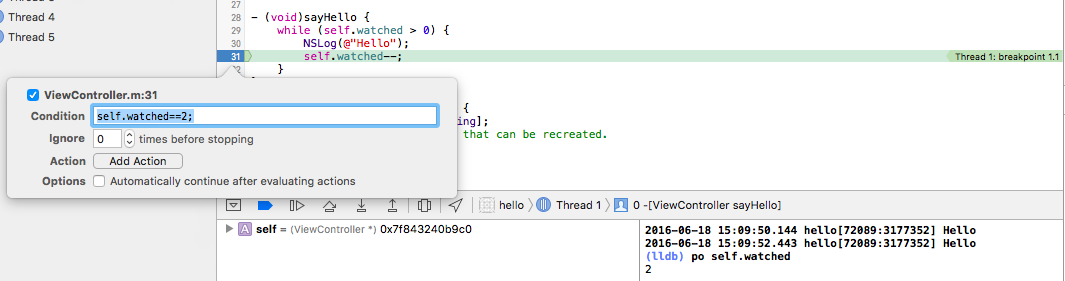
XCodeでも使えます。(例でViewController自身にセットしていますが、特に意味はないです)
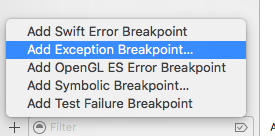
例外キャッチ
例外キャッチも紹介だけしておきます。 LLDBでも-Eオプションで設定できる様ですが私は使ったことありません。 LLDBを使っているとクラッシュした場合は、自動で停止してくれるので。
例外キャッチはXCodeだとここから設定できて、ものすごく便利な機能ですね。
変数の確認
さて、ブレークポイントで実行を止めたあとは、その時の各変数の値を見ていきましょう。
変数の現在の値を見るにはexprコマンドまたはpコマンドを使います。
(lldb) s
Process 71179 stopped
* thread #1: tid = 0x2ff5b2, 0x0000000100000f4b hello`sayHello(count=3) + 11 at hello.c:11, queue = 'com.apple.main-thread', stop reason = step in
    frame #0: 0x0000000100000f4b hello`sayHello(count=3) + 11 at hello.c:11
   8    }
   9
   10   void sayHello(int count) {
-> 11       for (int i = 0; i < count; i++) {
   12           printf("Hello\n");
   13       }
   14   }
(lldb) p count
(int) $0 = 3
(lldb) expr count
(int) $1 = 3
変数countには、3が入っていることがわかりますね。
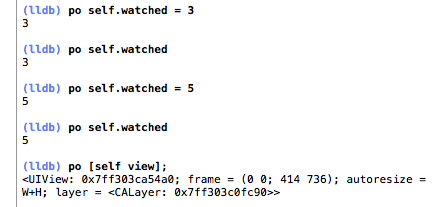
ちなみに、下記の様にpoコマンドを使うことで、式を評価することが可能です。
ここでは、countの値を5に上書きしています。
(lldb) po count = 5
5

(lldb) expr count
(int) $3 = 5
(lldb) c
Process 71322 resuming
Hello
Hello
Hello
Hello
Hello
Process 71322 exited with status = 0 (0x00000000)
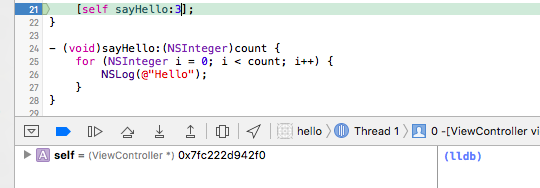
もちろんXCodeでも同じことができ、オブジェクトの評価をしてくれます。
スタックトレースの表示
スタックトレースはbtコマンド(バックトレース)で表示させることができます。
(lldb) s
Process 71331 stopped
* thread #1: tid = 0x301691, 0x0000000100000f4b hello`sayHello(count=3) + 11 at hello.c:11, queue = 'com.apple.main-thread', stop reason = step in
    frame #0: 0x0000000100000f4b hello`sayHello(count=3) + 11 at hello.c:11
   8    }
   9
   10   void sayHello(int count) {
-> 11       for (int i = 0; i < count; i++) {
   12           printf("Hello\n");
   13       }
   14   }
(lldb) bt
* thread #1: tid = 0x301691, 0x0000000100000f4b hello`sayHello(count=3) + 11 at hello.c:11, queue = 'com.apple.main-thread', stop reason = step in
  * frame #0: 0x0000000100000f4b hello`sayHello(count=3) + 11 at hello.c:11
    frame #1: 0x0000000100000f29 hello`main + 25 at hello.c:6
    frame #2: 0x00007fff8de025ad libdyld.dylib`start + 1
下から2行目でmainが呼ばれ、そこに乗っかる形でsayHelloが引数に3を入れて呼ばれていることがわかります。
スタックトレースはXCodeだとブレークポイントで止まった時に左側に表示されています。
通常のアプリ開発で必要になりそうなLLDBの基本的な機能はこれで大体網羅できていると思います。
GDB、LLDBはデバッガーという性質上、非常に高機能であり、レジスタの値を直接見ることもできるため、プログラムの詳細な挙動を調べるときにもとても役立ちます。
興味のある方はぜひ調べて挑戦してみてください。
まとめ
IDEでしかデバッグをしたことがないという方も多いと思いますが、いかがでしたでしょうか?
今回紹介したLLDBの機能はXCodeでそのまま使える機能ばかりです。
特にWatchpointはXCodeではGUIでのインターフェースの提供がないと思います(少なくとも私は知らない)ので、使ってみるとそのパワーにきっと驚くと思います。
また、今回はXCodeの紹介もしましたが、Android StudioやEclipseでも同じ機能は使えますので知らない方は探してみてください。
IDEのデバッガの裏ではLLDBやGDBなどのツールが動いていますので、より詳細にバグの原因を調べたりしたいときはこういったコマンドを調べてみることをお勧めします。
以上、LLDBを触ってIDEのデバッガーを理解する、でした!